
Trading in the share market is often considered as an easy way to make some money. Although trading is more than a gamble, it hasn’t stopped individuals from treating it like one. Some investors invest in the share market aiming for long term results. Whereas, there are many individuals who look for fast returns. When it comes to the second type of investors, intraday trading suits them perfectly. The intraday literally means within the day. Hence, intraday trading can be explained as the kind of trading where the entire process of buying and selling of shares takes place within the same trading day. You need an active trading account in order to be able to do intraday trading.
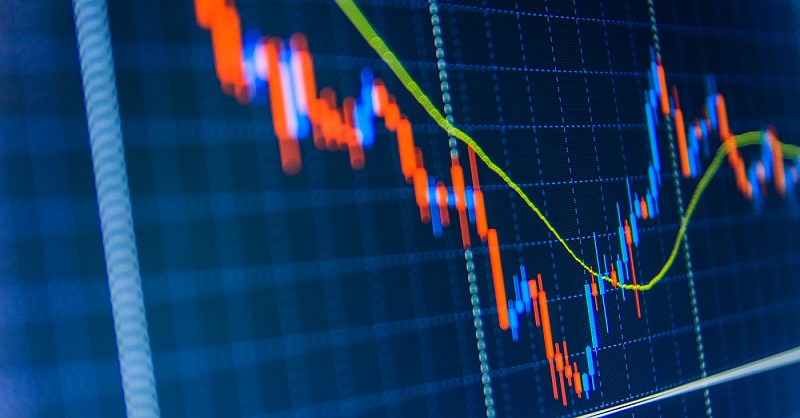
Intraday trading often comes off as a really easy and uncomplicated method of trading in the share market. But the experienced traders will happily tell you that it is not the case. As simple as it looks, intraday trading is a high risk game. It is so due to the fact that earning profits in intraday trading depends upon carefully monitoring the share market movement, for which the trader has to be vigilant at all times. The entire process requires a lot of research and analysis. And to make things easy for themselves, traders often use the intraday trading indicators. Intraday trading indicators are tools that are used along with strategies in order to gain maximum returns from a trade. In this article, we will tell you about a few intraday trading indicators that are regularly used by traders.
1.Moving Average: A Moving Average (MA) shows the average closing price of a share for the desired time period. As the price movements are unstable, there are no guarantees that price movements have any long-term trend. MA segregates this trend by displaying the average closing price for a certain time period. When the short-term average is higher than the long-term average, it usually indicates that the market is bullish about the shares under observation.
- Bollinger Band: This is essentially the advanced version of the moving average.This is a band that shows how the price deviates on average from the moving average over a period. In simple words, it indicates the volatility in the market. It is a highly popular technique. Traders usually believe the closer the prices shift towards the upper band, the further overbought the market is, and similarly the closer the prices shift towards the lower band, the more oversold the market.
- Momentum Oscillator:This indicator depicts the intensity of the demand for a particular share at any price point. For instance, if the share price is rising and moving toward the weekly high, yet the momentum oscillator is falling, a trader deduces this to demonstrate that the price will soon turn as the demand for the share is falling. Then again, an uprising momentum oscillator shows that the pattern is solid and is probably going to keep on holding.
- Relative Strength Indicator(RSI):RSI is easily one of the most often used and recommended oscillators. The relative strength index (RSI) is a momentum indicator which helps in calculating the scale of recent price changes to assess overbought or oversold circumstances in the price of a stock or other asset. The RSI is shown as an oscillator, meaning it is displayed as a line graph that moves between two extremes. It has a reading from 0 to 100.
These indicators illustrate the conditions and serve as a roadmap to show whether the stock is trending up or down. All the investors who trade in the market rely on all of these indicators to read the market efficiently in order to make profits. Learning to analyze and read these indicators will help you grow as an intraday trader and assist you to earn a lot of profits. We hope this article which talks about the intraday trading indicators has been helpful.